Elk even jaar, wanneer het winter wordt, publiceert de Centrale Raad voor het Bedrijfsleven (CRB) het 'Technisch verslag over de maximale beschikbare marges voor de loonkostenontwikkeling'. Dit document is de voorbereiding voor interprofessioneel overleg waarbij een herenakkoord tussen de koepels van de werknemers- en werkgeversfederaties wordt gesloten met betrekking tot de maximale loongroei in de komende twee jaar. Er wordt een simulatie gemaakt van de loongroei in België op basis van prognoses voor enkele buurlanden en belangrijke handelspartners: Nederland, Frankrijk, en Duitsland. Het advies van de CRB wordt door de Wet van 1996 'tot bevordering van de werkgelegenheid en tot preventieve vrijwaring van het concurrentievermogen' voorgeschreven, maar is niet bindend. Het interprofessioneel akkoord (IPA) dat de sociale partners in de informele Raad van Tien overeenkomen, is dat namelijk ook niet. Alleen wanneer de sociale partners er niet uitraken kan de regering de loonnorm bij wet afdwingen. Bij het vorige overleg hadden we een soort tussenoplossing, waarbij er wel een gedeeltelijk akkoord was (ABVV had niet getekend), maar de minster per Koninklijk Besluit de zaak cementeerde. Dit als context.
De vernieuwde loonnormwet - ik weet niet of die al van kracht is, maar klaarblijkelijk wel - schrijft voor dat het CRB een veiligheidsmarge van 0,5 procent voor, en automatische verrekening van loonkostontsporingen in opeenvolgende interprofessionele akkoorden. De veiligheidsmarge in acht nemend schrijft het CRB dus een reële loongroei van 0,9 à 1,2% voor - dat wil zeggen dat de lonen in Nederland, Duitsland, en Frankrijk verwacht worden om er met 1,4 à 1,7% op vooruit te gaan in de komende twee jaar. Waarop is die 0,5% gebaseerd? Uiteraard niet op economische logica. Zelfs de loonnorm is een eigenaardig principe: men verbiedt werkgevers om competitieve lonen uit te betalen. Economisch gaat men over het algemeen uit van het 'meer is beter' en 'vrijwillig is best' principe. Niet zo dus met de loonnorm, daar vind de overheid het belangrijk dat er institutioneel wordt tussengekomen op de arbeidsmarkt. De rigiditeit is nogal relatief: in werkelijkheid zien we op alle mogelijke manier dat de loongroei afwijkt van de loonnorm - dit heet loondrift. Dat kan door wijzigende kenmerken (leeftijd, scholingsgraad) van de werknemers, door baremieke aanpassingen om een loonstijging te verdediging, en door de wildgroei aan netto- en naturavoordelen, die de indruk geven dat men toch iets extra's krijgt. De fiscus betaalt dan het gelag, want zonder brutoloonstijgingen sputteren de overheidsinkomsten - om die reden is het trouwens eigenaardig dat de lonen altijd in het visser komen bij een 'austerity'-beleid: de verloning van arbeid is niet verantwoordelijk voor de financiële en monetaire crises, en wellicht net een oplossing voor de vraagschokken van 2009 en 2012 - en de reden waarom België er eerder dan andere landen is van hersteld.
Nochtans is een loonnorm geen slecht idee. De economische realiteit zal altijd wel op de een of andere manier zorgen voor een evenwicht. Een wisselkoers is de handigste optie, maar er zijn nog veel andere checks en balances voor wie in een muntunie is gestapt. Wat de loonnorm dan doet is het afremmen van een toenemende loodsongelijkheid tussen sectoren, wat middelen vrijmaakt voor B2B relaties met afhankelijke sectoren waar de loonstijging - bijvoorbeeld door de index - niet gedekt is door de productiviteitsstijging, en waarvoor de vraag vrij inelastisch is. Bijvoorbeeld: een voedingsbedrijf gebruikt nieuwe technologie waardoor het performance wordt, maar kan de werknemers daar maar in beperkte mate van laten meegenieten. Haar producten worden afgenomen door een warenhuisketen, wiens werknemers niet productiever worden, maar wel relatief duurder. Dit gaat meespelen in de onderhandeling tussen leverancier en verdeler, waardoor er een transfer van productiviteit tussen sectoren plaatsvindt. Dit is het collectief overleg op z'n best.
De loonnorm en indexering houden elkaar in evenwicht als centrale mechanismen in de Belgische loonvorming. Beide nemen uitputtende onderhandelingen over, en zorgen er enerzijds voor dat vakbonden naast lonen voor insiders ook tewerkstelling voor outsiders mee betrekken in hun strategie, en anderzijds dat werkgevers geen kunstmatige opdelingen van sectoren gaan maken waar de delen zonder productiviteitsstijging worden afgezonderd om vervolgens te worden uitgebuit - de bron van ongeveer alle vormen van ongelijkheid in het buitenland. Toch is het belangrijk dat er überhaupt nog enige marge overblijft, niet alleen om over te onderhandelen, maar ook om innovatie aan te moeten. Het is paradoxaal dat men de marge aan de onderzijde gaat zoeken, bij die lonen die enkel stijgen door indexering. Men wil dus geen vrijheid voor bloei, maar enkel om te snoeien. De strategie vandaag is dus allesbehalve ambitieus: op z'n best wil de Belgische economie een half procent minder productief worden dan de buitenlandse - hetzij door technologisch achter te blijven, hetzij door het loonaandeel in het bbp ten belope van 0,5% van de potentiële toename in de loonmassa van arbeid naar kapitaal te verschuiven - alvast geen recept tegen een terugvallende consumptie.
Het zou realistischer zijn om op z'n minst een reële 'onderhandelingsmarge' van 2% voor te schrijven, zodat de eigen productiviteitsgroei alvast deels kan worden gehuldigd, en daarbovenop de vergelijking met de buurlanden te maken. Ook dit moeten we in vraag stellen: jaar na jaar zien we hoe verschillend het beleid in Duitsland (extreme flexibilisering), Nederland (strik budgettair beleid), en Frankrijk (de facto geen collectief overleg meer over minima) is. We vergeten dat we ook het Verenigd Koninkrijk en Luxemburg als buurlanden en handelspartners hebben, maar ook andere landen waarvan we de taal niet spreken. Men heeft geen economische glazen bol, en helaas zelfs bitter weinig statistische gegevens over de loonevoluties in het buitenland in het verleden - maar de vergelijking met drie zeer verschillende en eerder economisch instabiele buurlanden is vandaag allesbehalve een goed ijkpunt. Het is moeilijk voor Belgen om dit toe te geven, maar ons land was een baken van rust in een woelige Eurozone, met een gestage tewerkstellingsevolutie, meer stabiele economische groei, en zelfs een gemiddeld inflatieritme zoals de ECB het voorschrijft. Ook de Europese Commissie lijkt te gaan beseffen dat er een rol weggelegd is voor het institutionele verhaal om naar nominale convergentie van de Europese economieën te gaan. Het recept waarbij de politiek het overneemt van de vrije onderhandelingen, leidt immers enkel tot een neerwaartse spiraal van nivellering en groeivertraging. Lawaaimakers voelen zich misschien ongemakkelijk bij een typisch Belgisch compromis, maar dat catalogeer ik onder geldingsdrang.
woensdag 14 december 2016
woensdag 7 december 2016
Bewuste domme vraag over pensioenen
Onze overheid grossiert in verdoken belastingen, dat weten we, maar wat men nu heeft verzonnen tart toch alle verbeelding. We moeten studiejaren afkopen om een volwaardig pensioen te genieten. Het wordt voorgesteld als een 'koopje': ca. 1500 EUR voor elk studiejaar, met ongeveer een fiscale aftrek van 50%. Om te beginnen is dit zéér asociaal, want je moet natuurlijk eerst een voldoende hoog inkomen hebben voor je de uitgave van je belastingen kan aftrekken: arme hoogopgeleiden betalen dus het gelag. Veel tijd krijgen we ook niet, de solden lopen maar tot 2020. Om niet te veel tijd te verliezen met denken en opzoekwerk dus deze bewuste domme vraag: worden wij hier bestolen?
De wettelijke pensioenleeftijd wordt in 2025 verhoogd tot 66 jaar en in 2030 tot 67 jaar. Mits voldoende gewerkte jaren kan dat eerder. Om de studiejaren te laten meetellen als voldoende gewerkt, moeten we dus het losgeld betalen. Dat is sterk! Op het moment dat ik ging studeren was de pensioensleeftijd 65 zonder dat losgeld. M.a.w. studeren kostte wat het kostte, niet 1500 EUR méér, wat een disincentive zou zijn. Om nu een volwaardig pensioen te genieten moet die meerkost betaald worden. Men stelt het alsof na drie jaar (250 EUR per jaar versus losgeld van 750 EUR) die kost is terugverdiend. Dat is vals: de 750 EUR ben je nog steeds kwijt, want die werd eerst afgetrokken van het volwaardig pensioen bepaald bij aanvang van de carrière. Men eist nu immers 67-18 = 49 in plaats van 67 - 22 = 45 gewerkte jaren. Een ongelofelijke belasting van hoger opgeleiden. Men kan denken: net goed, die hebben toch de hoogste lonen - gemiddeld is dat zo, maar het zal je maar overkomen hoogopgeleid en werkloos te zijn, of werknemer bij ING. Bovendien maakte dit helemaal geen deel uit van de studiekeuze. Wie vandaag nog moet kiezen, wordt aangemoedigd de lageloonoptie te nemen, want dan krijgt je op een normale manier je pensioen na voldoende gewerkte jaren of op de leeftijd van 67. Wil men van België Bangladesh maken?
Dit gaat niet over het principe van langer werken - daar heb ik mijn eigen ideeën en voorstellen voor. Wat van fundamenteel belang is, is het vertrouwen. Een onbegrijpelijk en fundamenteel ongelijk systeem kan dat niet realiseren. Men heeft van het pensioenstelsel een spelletje gemaakt. Het oude systeem was eenvoudig: men betaalt belastingen, waarvan een deel virtueel op je rekening komt die ergens plafonneert, maar dat in werkelijkheid uitgekeerd wordt aan de gepensioneerden op dat moment. Zo'n repartitiesysteem heeft het nadeel dat men door demografische en economische schommelingen soms de beloftes niet kan waarmaken, maar via een relatief systeem met punten kan daaraan tegemoet gekomen worden en blijft er een incentive om komende generaties een erfenis van hoge productiviteit te geven - immers, dit garandeert uw eigen pensioen.
Omdat de markt zo haar verlangens heeft raakte het kapitalisatiesysteem in de jaren 1990 in trek: via de werkgever (tweede pijler) of op eigen houtje (derde pijler) spaar je op een door de overheid gegarandeerde spaarrekening. Het sparen zelf wordt fiscaal aangemoedigd. Dit is een plundering van de staatskas vandaag en roofbouw op de productiviteit morgen. Bovendien blijken die fondsen niet altijd robuust. In Hongarije heeft men de bevolking quasi gedwongen het spaargeld op te geven in ruil voor de zekerheid een deel te krijgen van wat te verdelen valt via repartitie. Daar komt nog bij dat het een huzarenstukje wordt om carrières te gaan reconstrueren om het bedrag uit de tweede pijler binnen te halen, en dat je bank die derde pijler hopelijk nooit richting restbank zwiert. Eerst wordt de werknemer op dit gammel schavot geplaatst, en nu ook nog gechanteerd tot een niet onaanzienlijke belasting (bvb. voor mij minstens 5*1500 = 7500 EUR voor belastingen) waarvan de return zeer onzeker is. Kunnen wij dit pikken? Neemt men ons voor gek?
woensdag 30 november 2016
Origin of debt
A few interesting observations:
The gov. debt as a percentage of GDP only expresses the extent to which the country is able to pay back the debt. As it has GDP in the denominator, it is sensitive to business cycle swings. Let's look at the picture when expressed in euros (below). The first thing we notice is that we cannot compare levels, as countries are of unequal size, something the GDP accounts for in the above statistic. However, we can now judge whether governments have made the choice to either pay back debt, or reduce taxes. Typically, Ricardian economists would say both are equivalent, but clearly in practice there is a great deal of debate on either, so it may not be neutral in the short run. For instance: foreign companies may be attracted by the low taxes, but not by lower state debt. For political parties, the promise of low taxation may yield more voters, who are blind to the state debt that will eventually have to be repaid. So as a second observation, we see that in Belgium and the Netherlands, state debt was never repaid - mind that this would cost around 30 billion EUR in Belgium for any 10% decrease in the ratio with GDP if GDP is stable.
Of course, besides the size of the economy and productivity, GDP also accounts for inflation, so surely if one counts on inflation debt will evaporate. Unluckily, there was no inflation since the crisis, and we flirted with deflation for a while. I believe austerity measures in Europe, while trying to sanitize budgets in order to increase the confidence in states, have had a reverse effect by decreasing demand, lowering inflation, and hence increasing the debt ratio.
Remarkably, in this chart we see that in the UK, France, and Germany (the latter until 2010), gov. expenditure and debt skyrocketed in the last two decades. So the increase of the debt ratio is not only a demand shock, it is real debt growth. In relative terms, the state could afford the debt growth because GDP was growing. In that sense, the Netherlands and Belgium resisted the temptation.
To conclude: Belgium chose for lowering taxes, as an alternative to paying back debt in times of economic growth. Because growth and inflation slacked all across Europe after 2008, the debt ratio did not improve as much as maybe expected, likely because the strategy of lowering taxes resulted not in higher wages, but in higher profits which are relatively untaxed, so no increases in consumer expenditure nor of government expenditure, and hence a slowdown of the economy, as it was seen all accross the EU. Maybe Ricardian equivalence is correct in theory, but wrong in practice in the short run.
- State debt in Belgium is high, but much lower than 20 years ago. Also in Holland, we see a small decrease of state debt. In France, Germany, and the UK it increased.
- Importantly, most state debt in Belgium is in hands of local banks holding state bonds using the deposits of the citizens. In a way, the Belgian population ows itself 100% of its national product. This makes debt sustainable. Moreover, as interest rate are very low - both for bonds as, as a consequence, on deposits - historic debt has been refinanced, and current debt is not growing.
- The increase of debt between 2008 and 2009 is found in all countries, but most remarkably in the UK. This is surprising, as the fundamentals before the crisis were weak, but it still had its independent national bank, unlike Eurozone countries. It did not benefit from this to shield the British economy from the global demand shock.
- The two-year increase in Belgium in 2008 and 2009 was larger than the next six years - the government aid to the three largest banks must be behind this (Dexia, Fortis, KBC), mainly because in 2008 the rest of the economy was doing very well.
- The crisis was more costly to the Netherlands, both in absolute and relative terms.
- Germany, during the years of flexibilization, witnessed an increase of state debt - probably because of the integration of East-Germany, which was not an unambiguous success story. Since 2010, in the age of austerity, the state debt has decreased. As shown elsewhere, output caught on again as well. However, more people are now in poverty. It appears that growth - debt - inequality is an impossible trilemma.
The gov. debt as a percentage of GDP only expresses the extent to which the country is able to pay back the debt. As it has GDP in the denominator, it is sensitive to business cycle swings. Let's look at the picture when expressed in euros (below). The first thing we notice is that we cannot compare levels, as countries are of unequal size, something the GDP accounts for in the above statistic. However, we can now judge whether governments have made the choice to either pay back debt, or reduce taxes. Typically, Ricardian economists would say both are equivalent, but clearly in practice there is a great deal of debate on either, so it may not be neutral in the short run. For instance: foreign companies may be attracted by the low taxes, but not by lower state debt. For political parties, the promise of low taxation may yield more voters, who are blind to the state debt that will eventually have to be repaid. So as a second observation, we see that in Belgium and the Netherlands, state debt was never repaid - mind that this would cost around 30 billion EUR in Belgium for any 10% decrease in the ratio with GDP if GDP is stable.
Of course, besides the size of the economy and productivity, GDP also accounts for inflation, so surely if one counts on inflation debt will evaporate. Unluckily, there was no inflation since the crisis, and we flirted with deflation for a while. I believe austerity measures in Europe, while trying to sanitize budgets in order to increase the confidence in states, have had a reverse effect by decreasing demand, lowering inflation, and hence increasing the debt ratio.
Remarkably, in this chart we see that in the UK, France, and Germany (the latter until 2010), gov. expenditure and debt skyrocketed in the last two decades. So the increase of the debt ratio is not only a demand shock, it is real debt growth. In relative terms, the state could afford the debt growth because GDP was growing. In that sense, the Netherlands and Belgium resisted the temptation.
To conclude: Belgium chose for lowering taxes, as an alternative to paying back debt in times of economic growth. Because growth and inflation slacked all across Europe after 2008, the debt ratio did not improve as much as maybe expected, likely because the strategy of lowering taxes resulted not in higher wages, but in higher profits which are relatively untaxed, so no increases in consumer expenditure nor of government expenditure, and hence a slowdown of the economy, as it was seen all accross the EU. Maybe Ricardian equivalence is correct in theory, but wrong in practice in the short run.
dinsdag 29 november 2016
Execute R code in Stata / Read SPSS data files
On 64-bit Windows OS and on Mac, the -usespss- command does not work. If you want to use SPSS data (or SAS), without quitting Stata, do something like this:
rsource, terminator(END_OF_R) rpath(R_pathname)
library(foreign);
rprecar<-read.spss("precar.sav", convert.f=TRUE);
rprecar
attributes(rprecar);
write.csv(rprecar,"rprecar.csv", na = ".");
It may be tricky to find your R_pathname. I didn't bother looking up what it is for now - probably the path to the executable (which sucks, because on every computer it will be different). In the example the conversion goes to csv, and there's the missing values ("na") option. The foreign package actually also allows old Stata 9 files, which is just fine and will preserve most labels, variable names, and missing values.
Here's the info for -foreign-:
https://cran.r-project.org/web/packages/foreign/foreign.pdf
rsource, terminator(END_OF_R) rpath(R_pathname)
library(foreign);
rprecar<-read.spss("precar.sav", convert.f=TRUE);
rprecar
attributes(rprecar);
write.csv(rprecar,"rprecar.csv", na = ".");
q();
END_OF_RIt may be tricky to find your R_pathname. I didn't bother looking up what it is for now - probably the path to the executable (which sucks, because on every computer it will be different). In the example the conversion goes to csv, and there's the missing values ("na") option. The foreign package actually also allows old Stata 9 files, which is just fine and will preserve most labels, variable names, and missing values.
Here's the info for -foreign-:
https://cran.r-project.org/web/packages/foreign/foreign.pdf
Taxing robots or lowering minimum wages?
There's some errors in the logic, don't believe this.
There is a lot of talk nowadays in Belgium on either taxing robots or lowering the minimum wages. Remarkably, typically right-wing parties oppose the first and opt for the second, while typically left-wing parties propose the first and object to the latter. Personaly, and consistently, I am not in favour of any of the two measures, because indeed... they are the same.
Basically, by taxing robots, capital is made more expensive, which causes a shift to labour as an input factor. Similarly, the relative price of labour may go down by lowering the minimum wage, causing the exact same shift between the two input factors, all else being equal.
As I explained in another post in Dutch, one may argue whether to tax capital in general (profits, wealth, etc.) or wages. There could be an equivalence between all tax options. The main worry is that taxes cannot be avoided, which is why it is generally preferable to tax in tiny bits everywhere (capital, consumption, income, transfers, real estate, inheritance, etc.) - this is my theory of chaos economics. However, for now it is clear that labour is easily traceable, and hence an easy target for taxes. The only condition is that wages are sufficiently high, so what matters is not the tax rate - which you should calculate over all sources - but the wage share, which should be around 75% for a steadily growing economy, if the second half of the 20th century is to be taken as an example.
So please, do not tax robots - increase wages!
maandag 21 november 2016
Time stamp
Making a time stamp is not very straightforward. The first two local do not deliver a nice year-month-day prefix, so we need to use a trick:
local mydate c(current_date)
local mydate=date(c(current_date),"DMY")
local mydate: di %tdCYND date(c(current_date),"DMY")
global date = `mydate'
di $date
local mydate c(current_date)
local mydate=date(c(current_date),"DMY")
local mydate: di %tdCYND date(c(current_date),"DMY")
global date = `mydate'
di $date
zondag 20 november 2016
The elephant in the room: the economic, political, and social impact of changes in the global income distribution
This post may have a wonderful title, but I intend to keep it short nevertheless. I am sure my summary can be hooked up to many story on income inequality that circulate and go into much more detail.
There are actually two (types of) charts I want to combine. The first is Branko Milanovic's now famous elephant chart from a 2002 World Bank Discussion Paper. It looks like this:

What is says is that from the global income distribution, the world's lower middle class has been growing, while at the same time the world's upper class saw its wealth increase, but not the poorest of the world nor the upper middle class globally. Also quite interesting is that this growth seems non-zero sum, as capitalist thinkers like to emphasize. Nearly nobody is worse off, and many are better off. Hence, following Rawls, there would be little to worry about.
Yet there is another graph, that shows the decline of the middle class (defined as 2/3 of median income to twice median income) over time between 1971 and 2015 as drawn up PEW Research together with the Financial Times. It is reported in the apocalyptically sounding article "America’s Middle-class Meltdown: Core shrinks to half of US homes. Society splinters as bedrock of postwar economy is ‘hollowed out’". Let's see what happened:

So while the bulk of the distribution of 1971 is fading by about 1/3 and now almost uniformly distributed, the upper half is growing and the top percentiles are more than quadrupled in their count. To quote the article:
"Since 2008, the number of adults in households in the upper two tiers has grown by 7.8m, outpacing the growth in the number of adults in households in the lower two tiers, where the number of people grew by 6.8m. The middle class grew by 3m over the same period."
The political impact
It is no coincidence that these graphs circulate now that Donald Trump is president elect. The decline of the middle class in the West is raising concerns amongst those who do not benefit from globalization. Why would they favour it then? I see it as a very simple prisoners' dilemma: any party chooses for control over self-interest, when coordination of mutual gains fails. The liberal establishment in the UK and the US has surfed on a wave of globalization, but apart from the Coasts in the US and the City in the UK, people have not seen the benefits of it. People don't care about average, they care about where they are relative to the average. Hence Trump, hence the opposition to CETA and TTIP, hence Brexit, and worse: hence hatred to anything and anybody that is not visibly contributing to one's self interest. People are not more xenophobic than ever, but they don't see the use of migrants, only the hassle. The ones that had always been racist now find legitimacy in this to misbehave. Yet the roots are still in the game theory: if the coordination would work - say, free trade levels up social rights and internalizes environmental costs - people might sacrifice some of their autonomy (power) and direct control, because they trust they will be better off.The social impact
I have already hinted at the social impact above, referring to Rawls and referring to peoples relative wealth. Of course this is what matters. Absolute wealth is absolutely unimportant from a social point of view. Mind the adjective social: there is nothing social about comparing yourself with the stone age, that is historical. Nobody in this world would have any right to complain when put in historical perspective, as we are all better off. Even the poorest of the poor are not hunted by lions anymore, and in comparison, very weak people now have a fair chance to survive, whereas they would not have stand any chance some thousands of years before. Rawls argument that inequality is fair if anybody improves, is therefor blatantly flawed. For the sake of clarity, let me invert the reasoning above: if people are happy because they have more, they should be less happy if they have less. Hence Napoleon Bonaparte, who did not have an iPhone, should have been very unhappy to have to wait over 100 years before reaching the living standard of today. I believe this reductio ad absurdum shows that Rawls is wrong: deprivation is a relative concept in the minds of people. Imagine you are rich, but you bring your children to a school for the absolute elite of your country. Even if your kids may already be spoiled by you, they will feel dropped behind compared to the even richer kids, who may get a pony instead of a bicycle at ten years old. It is easy to see that this shapes the experience. Going from toys to trauma, it is now understandable that suicide is not the most individual, but actually the most social act, and occurs more frequently in more prosperous society, where the pie is larger and the distribution more unequal.
The economic impact
Finally, the unequal distribution of wealth also has an effect on the economy. Let us stick for now to the US graph above. Assuming that the middle class is the class who spends the share of added value earned. The upper class saves the money and the underclass may have be a cost factor. So the middle class is the motor of the economy, and its number is the fuel. Then we see the paradox that as countries develop, inequality grows, the society gets polarized, and growth slacks. Sadly, in the middle of the 20th century, it took World War 2 to restore the balance - temporarily. Workers in general, and women in particular, could no longer be left behind, as they had witnessed the worst consequences of war. Bloomberg calls for urgency, quoting an unusual system critic:
"When people like Deutsche Bank are starting to say, 'maybe capitalism needs a form of reinvention,' maybe that's the time to start listening to that," he said during an interview on BloombergTV. "It's not Bernie Sanders; it's a global investment bank."
Digging a little bit deeper in the mechanics of this boom and bust scenario, there are two ways to explain it. The Stockhammer-Onaran story goes like this: national income may come from consumption or from exports, but if an economy is closed, as is the world's economy, but probably also the EU and the US, it needs to come from consumption. Only single regions can benefit from the export-led growth. As a rule, most economies however are wage led. The second story, mine, does not contradict the first, but draws attention to the following logical fallacy: when wages are under pressure and profits increase, these profits go to savings and investments. This brings about an perpetual series of mergers and acquisitions, for cheap. However, these acquisitions only appear cheap because they are statically misvalued. They are worth much less, as there is less demand (purchasing power) for the goods. So the capitalist buys shared or takes over a company, but these share will lose real value soon. Growth comes from technology and investment, not from financial juggling. So as the profits increase we have a boom, for instance the dotcom bubble or the real estate bubbles, but soon after this leads to a bust. In the Financial Times article we do see the trend of increasing polarization taking a step back in 2011. Paul Krugman recently posted the US real GDP evolution on Twitter, arguing the Great Recession was not so unnatural after all and growth has caught up again. So the boom-and-bust scenario may economically lead to some Schumpeterian creative destruction, or maybe even give directions for policy, so that in the end growth continues, but there is no counterfactual: what growth would have been realized in a steady way, without the hassle?
Going back to the elephant graph, we need to extend the economic story. After all, it may be that the western middle class loses its purchasing power, but that the non-west former world underclass now creates demand. It may well be, and I don't know exactly what is behind the graph, but one flaw I anticipate is that the worlds upper class is not only western. Hence the unfair distribution of wealth is not a global redistribution, but it is in fact a global increase in inequality. In every market, those who earn least get less of the pie. Say an Indian worker earns 10 USD a week - I really have no clue - and witnesses an increase to 15 USD thanks to globalization. The Indian businessman, however, goes from 10 000 USD to 15 000 USD, increasing the absolute gap. In general, for the study of wages and remuneration, and because of the social aspect, I believe log wages are more reasonable as they represent relative differences, but for the economic aspect, this absolute difference may matter. The US worker, for instance, might have gone from 100 to 150 USD a week or more, but this gain went to the top class, bought out by cheaper labour outside the West.
Conclusion
There is an elephant in the room and many if not most political actors do not see it. However, the political, social, and economic story that are all linked to the growth of inequality should be clearly disentangled for practical purposes. In each field specific efforts are to be made: politically, the story of coordination needs to be made clear and demonstrated - there are non-zero sum gains to be made and distributed. Socially, more equality will increase the perception of fairness and self-belief, leading to seizing more opportunities like schooling and entrepreneurship, instead of social upheaval. Economically, a stable and optimal distribution of added value, i.e. a fixed wage share more than taxation and whatnot, ensures continued consumption, stable asset prices (!), and hence real, global growth. Failure to convince the relevant actors of what needs to be done on one of the three fields will necessarily also leads to a collapse in the other. We are well on our way to realize such a catastrophe and get trampled by the elephant we do not see.
zaterdag 19 november 2016
België uit de crisis
De VS en Duitsland kwamen het snelst uit de crisis, maar ook de Belgische economie kwam in 2016 opnieuw op het niveau van 2008 (zie grafiek BBP per capita). Nederland haalt het piekniveau van 2008 nog niet terug, maar heeft samen met de VS een beduidend hogere productiviteit. Frankrijk en het Verenigd Koninkrijk presteren ondergemiddeld, België en Duitsland zijn naar elkaar toegegroeid en zitten in 2015 op hetzelfde niveau.
Hey, Silicon Valley
18 okt 2016. WIRED
Hey Silicon Valley: President Obama Has a To-Do List for You
From the contribution of Tim O'Reilly:
"This all may sound obvious, but far too little of the tech industry operates this way today. We’ve gotten to a point where companies aren’t even trying to build a business that will produce profits; they are just trying to stay funded long enough for another company to acquire them. They are actively chasing the waste instead of the win. That misplaced focus isn’t just annoying, it contributes to global inequality, because it emphasizes capturing value instead of creating it. It reminds me of Wall Street in 2007.
And it echoes the story of the economy writ large. Over the past 30 years, wages have largely flatlined as corporate profits have surged, which means that companies in other sectors too are capturing more wealth than they are creating. This is a recipe for economic stagnation. Consumer demand is 70 percent of GDP. So when companies treat people solely as an expense to be automated away, or as mere supply of wealth to be extracted, they are slowly cutting their own throats."
vrijdag 18 november 2016
Wie betaalt wat?
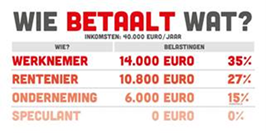
Linx+, de culturele afdeling van het ABVV - en dus het ABVV - verspreidt dezer dagen een tabel met een rake vergelijking van de belastingvoet voor hetzelfde inkomen dat op verschillende wijze werd gegenereerd. De sociale onrechtvaardigheid is onmiddellijk duidelijk.
Ik beperk mij hier tot een eerste, intuïtieve reactie en dat is de volgende: niet de verschillen in de belastingvoeten zijn belangrijk, maar wel a) hoeveel procent van de brutowinst naar werknemers gaat (loonaandeel toegevoegde waarde), b) hoe efficiënt de staat werkt (ratio output tegenover overheidsbeslag).
Waarom is de verdeling op zich niet belangrijk? Eenvoudigweg omdat het een boekhoudkundige zaak is: men kan de werknemersbijdrage voor de sociale zekerheid ook meteen verrekenen bij de werkgever, en dan zou de belastingdruk zich naar dat niveau verplaatsen.
Waarom is het wél belangrijk welk aandeel van de brutowinst werknemers krijgen: vooreerst omdat ze het spenderen (wat BTW oplevert), daarnaast omdat het niet vlucht zoals ander kapitaal en dus gemakkelijk belast kan worden (zie punt 1).
De efficiëntie van de staat bepaalt ten slotte wat de werkelijke belastingdruk is. Neem zorg of onderwijs als voorbeeld. Dit kan privaat of door de overheid worden voorzien. Als de staat goedkoper werkt, bijvoorbeeld door haar natuurlijk monopolie, dan de privé-sector, dan kan men niet spreken van een hoge belastingdruk. Als de staat daarentegen de verkeerde investeringen maakt, met het mandaat van de kiezer, dan moet de kiezer zijn keuze in vraag stellen. Het grootste probleem is echter wanneer de kiezer baat heeft bij een inefficiënte staat, bijvoorbeeld als ambtenaar, of als ondernemer in het irreguliere circuit.
zondag 6 november 2016
Zero marginal costs
There is an interesting phenomenon on its way which we do not fully understand yet. It's the computer revolution. Now many observer believe that the second machine age is like the first, that technology has always been seen as a threat but in hindsight created more work and welfare. I do not buy that for a number of reasons.
First, the simple stat is flawed. Yes, more people work and there is more welfare, but there are also many more people living on earth compared with the middle ages. We do not have precise observations, but it is not unlikely that the majority of the people before the industrial revolution were all working full time, regardless of age and sex. So the machines may have enhanced the labour force, and freed up time for leisure for most, but some are unlucky not to have the skills that suit a machine. In order to let them accept the introduction of technology, we should therefore always distribute welfare, also to those who have made room for progress.
Second, in this machine age, I believe we are heading towards a point were the very human aspect of labour, not its force, but its knowledge, is being substituted by computers. That is very different, because it excludes complementarity of capital and labour to a much larger extent. For now, this leads to job polarization, but soon software may take over more advanced tasks which have now fairly big gains, and robots might take over many service jobs that require a 'human touch'.
Third, the apologists say fear is not needed as the past predicts the future and we've sorted it out last time. I believe that is the wrong motivation. Fear is not needed, indeed, but not because nothing is going to change, but because it is possible to see a change for the better. Why, after all, would we want to work? We don't, that's why we ask a wage in return for the trade of leisure. For those who think this will lead to a demographic boom, maybe not: if we spend more time caring about individuals, we have a new constraint other than the price of education: the time which we cannot multiply. Also, procreation brings responsabilities, which we may want to keep under control.
Fourth, I tend to agree with Paul Mason that there will be a change of system. The steam machine introduced capitalism. After all, those machine are capital that allows the making of profits, of which part goes to the worker and the rest to the shareholder. The new technology works autonomous, which will actually take away profit. We tend to think of companies that adopt technology as labour-killers, but what they really are is profit-killers. The beauty of capitalism is that companies will always want to be the first to go on that road, because then profits actually increase. As soon as one more company follows, we have Bertrand competition that drives prices to zero, because software (the new capital) produces its goods and services at zero marginal costs. I thought of this a while back, and others have without a doubt too, but Paul Mason found a really interesting note of Karl Marx who predicted exactly this, and it is entirely in line with marxist economics. If labour becomes obsolete, there is no more income and no more turnover. So it is a system changer. Now before we yahoo about this, nobody knows what the new system will be. It is possible that we distribute according to needs, or based on a basic income scheme equally for all. It is also possible that capital holders will manage to protect intellectual right on software and intangible products (like a song or a movie), and have ordinary people sweat to obtain it without actually contributing much to society. Amongst capitalists, there will then be a fair amount of trade, owning brands and intellectual rights, and forming cartels much like today, while those who were former workers will then be slaves. Personally I think the latter scenario is most likely, even if it relies on reducing democracy. It is probably even already ongoing.
So in sum, there will be a change and it could be for the better or worse, depending on whether you catalogue more equality as the former or the latter. It certainly deserves a debate.
zondag 10 april 2016
EU28 Member States in seven clusters
It's a very repetitive task to always cluster European Union Members States, but despite the heterogeneity in any possible group of clusters, it is probably the only way to have a basis for comparison.
My preferred clusters consist of the EU-15 and the New Member States, or Central and Eastern Europe. Within each group, we can further split up by broad welfare state or cultural groups. The syntax below for Stata should be self-explanatory.
gene byte eu28 = 0
replace eu28 = 1 if inlist(geo,"BE","DE","FR","AT","NL") // Continental Western Europe
replace eu28 = 2 if inlist(geo,"GB","IE") // British isles
replace eu28 = 3 if inlist(geo,"SE","FI","NO","DK") // Scandinavia
replace eu28 = 4 if inlist(geo,"ES","IT","PT","GR") // Southern Europe
replace eu28 = 5 if inlist(geo,"HU","PL","SI","SK","CZ") // CEE Slavic (and Hungary)
replace eu28 = 6 if inlist(geo,"LT","LV","EE") // CEE Baltic
replace eu28 = 7 if inlist(geo,"HR","RO","BG","CY","MT") // CEE Balkan and Mediterranean Isles
Abonneren op:
Reacties (Atom)